
The key to improving ROI isn’t buying more expensive equipment; it’s systematically plugging the hidden profit leaks in your operation.
- Over-fertilization is a common budget drain, even on high-yield fields, and can be corrected with targeted soil data.
- Data interoperability is crucial; choosing the wrong equipment can lock you into a single, expensive ecosystem, negating savings.
Recommendation: Start by focusing on one area, like creating a simple variable rate fertilizer map from existing yield data, to see a tangible return before expanding your precision ag strategy.
For any small-scale corn farmer, the end-of-year math can be frustrating. You see good, healthy yields in the field, but when you look at the balance sheet, the margins are razor-thin. The pressure to “get with the times” is immense, with talk of automated tractors, fleets of drones, and complex software. For an operation under 500 acres, these high-capital investments often feel more like a path to debt than a road to profitability. You’re constantly weighing the cost of inputs against a volatile market, and every dollar counts.
The common advice to “invest in precision ag” often misses the point for smaller farms. The real issue isn’t a lack of technology; it’s the lack of a practical, cost-effective strategy. But what if the path to higher ROI wasn’t about a massive technological leap? What if it was about identifying and plugging the small but consistent “profit leaks” that drain your budget acre by acre? The truth is, a pragmatic approach to precision agriculture focuses on making a series of small, informed decisions that have an outsized impact on your bottom line.
This article moves beyond the hype. We are not going to tell you to buy the most expensive gear. Instead, we’ll give you a boots-on-the-ground framework for making smart, incremental changes. We will tackle the biggest drains on your profitability and the costliest mistakes farmers make when adopting this technology. From optimizing your fertilizer spend to ensuring you don’t get locked into a single equipment brand, you’ll get actionable steps to make precision ag work for your farm, not the other way around.
This guide breaks down the most critical areas where precision agriculture can deliver a real return on investment for small to medium-sized corn operations. Each section tackles a common question or pitfall, providing a clear path from problem to profitable solution.
Summary: A Pragmatic Guide to Precision Ag ROI on Small Corn Farms
- Why Over-Fertilization Costs You $50 Per Acre Despite Good Yields?
- How to Create a Variable Rate Prescription Map Without Hiring a Consultant?
- Satellite or Drone Imagery: Which Is Better for Early Disease Detection?
- The Data Format Mistake That Locks You Into One Equipment Brand
- When to Apply the Final Nitrogen Pass: Signals from Tissue Sampling
- Why Blockchain Records Can Still Be Fake if the Input Is Corrupt?
- Why You Don’t Need Full Wi-Fi Coverage for LoRaWAN Farm Sensors?
- How to Cut Irrigation Water Usage by 20% With Soil Moisture Sensors?
Why Over-Fertilization Costs You $50 Per Acre Despite Good Yields?
It’s a common paradox in modern farming: your yields look great, but your input costs are eating you alive. The number one culprit is often a blanket approach to fertilization. Applying the same rate of fertilizer across an entire field assumes that every square foot of soil is identical, which it never is. This inefficiency is a massive profit leak. In fact, a University of Minnesota analysis of farm business records found a $72 per acre difference in fertilizer cost between the most and least profitable farms, with no significant difference in yield.
This hidden cost comes from applying expensive nutrients where they aren’t needed. Areas with high organic matter or residual nitrogen don’t need the same application as sandier, less fertile zones. To stop this drain, you must shift from a uniform rate to a data-driven one. Start by using state-recommended nitrogen rates based on Maximum Return to Nitrogen (MRTN) calculations, which factor in current fertilizer and corn prices. This alone moves you away from a “yield-at-all-costs” mindset to a profitable one.
Next, get granular with your data. Conduct 2-foot soil sampling to account for residual nitrogen already in the soil profile before you apply anything. If your soil tests for phosphorus (P) and potassium (K) are already in the high range, stop applying at crop removal rates; you’re essentially just topping off a full tank. The goal is nutrient efficiency—making every pound of fertilizer count. Base your fertilizer type on the cost per pound of actual nutrient, not on marketing claims, to ensure you’re making a sound financial decision, not just a habitual one.
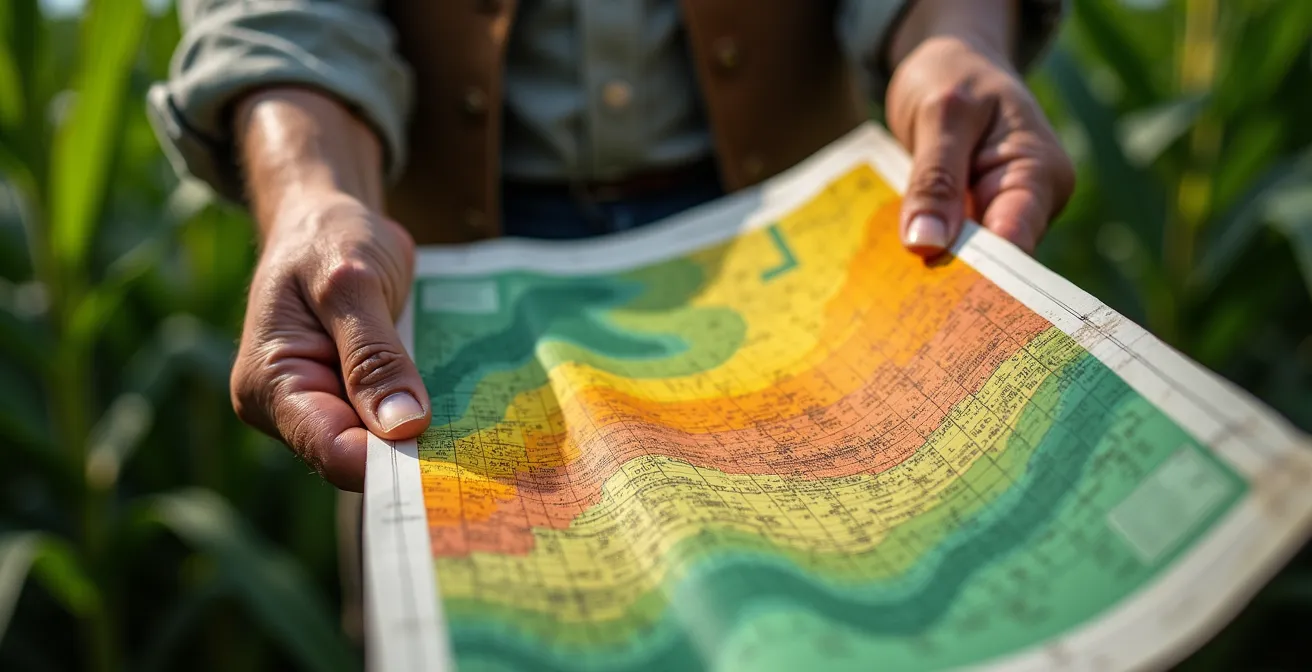
How to Create a Variable Rate Prescription Map Without Hiring a Consultant?
The idea of variable rate technology (VRT) sounds expensive and complex, often involving pricey consultants. But the core principle is simple: apply inputs only where they’re needed, based on a map of your field’s different “management zones.” For a small farm, you can create these maps yourself using data you likely already have. The goal is to move beyond treating your field as a single unit and start managing its unique zones for maximum efficiency. The financial incentive is clear; USDA research shows farmers using yield mapping with VRT reported average cost savings of $25 per acre.
The easiest entry point is using your historical yield maps from your combine monitor. Over several years, these maps reveal consistent high-yield and low-yield zones. You can import these files into farm management software (many have free or low-cost versions) to delineate these areas. A high-yield zone might get more nitrogen to push its potential, while a chronically low-yield sandy knoll might get less, saving you money on wasted fertilizer. Even without a yield monitor, you can use free public satellite imagery, like that from the Sentinel-2 mission, to identify variations in crop vigor (NDVI) and create basic management zones.
This approach moves from theory to practice with tangible results. It allows you to create a prescription (Rx) map that tells your spreader or sprayer exactly how much to apply in each part of the field. This targeted approach ensures your investment in inputs is directly tied to the productive potential of the soil.
Case Study: Central Illinois Farm’s DIY Zone Management
A farm in Central Illinois provides a powerful example. By adopting precision farming practices and creating their own management zones to guide input application, they saved an average of $67 per acre. This was achieved through a combination of reduced resource spending and increased production in high-potential areas, proving that you don’t need a massive budget to see a massive return.
Satellite or Drone Imagery: Which Is Better for Early Disease Detection?
Once you’re managing zones, the next step is monitoring crop health in real-time. Both satellites and drones are powerful tools for this, but they serve different purposes. Choosing the right one depends on your goal: broad-scale monitoring versus targeted investigation. Thinking one is a replacement for the other is a common and costly mistake. Satellites are your wide-angle lens, while drones are your microscope.
Satellite imagery, especially from free sources like Sentinel-2, gives you a complete picture of your entire farm every 3-5 days. It’s perfect for tracking general trends using standard indices like NDVI (Normalized Difference Vegetation Index), which measures plant vigor. This allows you to spot larger areas that are falling behind or showing stress. However, by the time a problem is clearly visible on a 10-meter resolution satellite image, it may already be well-established.
This is where drones excel. A drone equipped with a multispectral camera can provide ultra-high-resolution images (2-5 cm per pixel) on demand. More importantly, it can capture data for indices like NDRE (Normalized Difference Red Edge), which is sensitive to chlorophyll content within the plant leaf. This allows a drone to detect stress from disease or nutrient deficiency 3-5 days earlier than standard NDVI. This early warning is critical for timely intervention. The following table breaks down the key trade-offs.
| Feature | Satellite Imagery | Drone Imagery |
|---|---|---|
| Coverage Area | Entire farm in single pass | Limited by battery life |
| Resolution | 10-30m per pixel | 2-5cm per pixel |
| Frequency | Every 3-5 days (free) | On-demand |
| Cost | Free (Sentinel-2) | $500-2000 per flight |
| Early Detection | NDVI standard | NDRE detects 3-5 days earlier |
| Best Use | Broad monitoring | Targeted investigation |
The smart strategy is to use both. Use free satellite imagery for routine monitoring to identify “hot spots.” Then, deploy a drone (either your own or a hired service) to investigate those specific areas for early-stage diagnosis before walking the field. As one expert reminds us, technology is a guide, not a replacement for good judgment.
All of these [precision agriculture] tools are not meant to replace the power and value of our human brains and our human instincts.
– Courtney Nelson, Precision Agriculture Trainer, Northeast Community College
The Data Format Mistake That Locks You Into One Equipment Brand
Perhaps the single most expensive mistake in precision ag has nothing to do with the field—it happens in the dealership. When you buy a new monitor, tractor, or implement, you’re also buying into a data ecosystem. Some manufacturers use proprietary data formats that make it difficult or impossible to share information with equipment or software from other brands. This is “vendor lock-in,” and it can cost you dearly by limiting your future choices and forcing you into expensive, brand-specific solutions.
This lack of data interoperability is a major barrier to adoption. According to 2023 USDA data cited by the U.S. Government Accountability Office, only 27% of US farms used precision agriculture practices, and challenges with data compatibility are a significant factor. Imagine your new combine monitor saves yield data in a format that your old variable-rate fertilizer spreader can’t read. Suddenly, your ability to use that valuable data is compromised unless you upgrade your spreader to the same brand.
The solution is to demand “data freedom” before you buy. Your data is your asset, and you should be able to use it with any tool you choose. Before purchasing any new piece of precision ag hardware or software, you must ask the right questions. This isn’t just a technical detail; it’s a fundamental business decision that will affect your farm’s profitability and flexibility for years to come. Use the following checklist to protect yourself from getting trapped in digital handcuffs.
Your Data Freedom Checklist: 6 Questions to Ask Before Buying
- Does this monitor export data as generic file types like SHP or ISO-XML, or is it a proprietary format?
- Is there a subscription fee required to access, export, or transfer my own raw data from your cloud platform?
- Does your software platform have an open API (Application Programming Interface) for integration with third-party tools?
- Can this system receive and use prescription maps or sensor data from other brands’ implements and platforms?
- Are software and firmware updates that ensure future compatibility included, or do they require additional fees?
- Can I easily import and use my historical data from my current system, or is the process restrictive?
When to Apply the Final Nitrogen Pass: Signals from Tissue Sampling
Timing your nitrogen (N) application is one of the highest-stakes decisions you’ll make all season. Nitrogen is essential for yield, but it’s also one of your biggest expenses. According to Michigan State University, nitrogen represents 13-18% of corn production variable costs. Applying it too early risks losing it to leaching or denitrification, while applying it too late means the crop can’t use it effectively. Guessing on your final pass is like throwing cash into the wind. The key to an efficient late-season application is to let the plant itself tell you what it needs through tissue sampling.
Tissue sampling is a straightforward, “boots on the ground” practice. It involves taking leaf samples at key growth stages (like V5-V7 and again just before tasseling) and sending them to a lab for analysis. The lab report provides a precise snapshot of the nutrient levels within the plant, including nitrogen. This data is far more accurate than just looking at the color of the leaves. It tells you if the plant has enough N to reach its full potential or if a supplemental application is a worthwhile investment.
This process transforms your final N pass from a scheduled task into a data-driven decision. If the tissue samples show sufficient nitrogen levels, you can confidently skip that final, expensive application, saving significant money on both fuel and fertilizer. If the levels are low, you know that a final pass is a necessary investment to protect your yield. This is the essence of precision ag: using precise data to make profitable decisions, not just following a calendar.
Why Blockchain Records Can Still Be Fake if the Input Is Corrupt?
You may hear about blockchain as the ultimate solution for traceability in agriculture, creating a tamper-proof record of everything from planting to harvest. While the technology is powerful, it has a critical weakness that every farmer must understand: the “Garbage In, Garbage Out” principle. A blockchain is a perfect, unchangeable ledger, but it will perfectly and permanently record false information if that’s what it’s given. Its integrity is entirely dependent on the quality of the data fed into it.
This vulnerability is known as the “Oracle Problem.” In the world of blockchain, an “oracle” is the physical sensor or device that connects the real world to the digital ledger. This could be a soil moisture sensor, a weather station, or even a person manually entering data. The blockchain itself cannot verify if the sensor is calibrated correctly, if it’s malfunctioning, or if the data was entered inaccurately. It only verifies that a specific piece of data was recorded at a specific time.
For example, if a faulty soil moisture sensor reports that a field is dry when it’s actually saturated, the blockchain will faithfully record “dry.” An irrigation decision based on this flawed but “verified” data would be completely wrong. Therefore, trusting a blockchain record without first trusting the physical data source is a huge mistake. The system’s reliability is only as strong as its weakest link—the oracle. The focus for a farmer shouldn’t be on the blockchain itself, but on ensuring you have high-quality, well-maintained, and properly calibrated sensors providing decision-grade data from the start.
Why You Don’t Need Full Wi-Fi Coverage for LoRaWAN Farm Sensors?
One of the biggest misconceptions holding back sensor adoption on farms is the belief that you need robust Wi-Fi or cellular coverage across hundreds of acres. For a small farm, providing that level of connectivity is often prohibitively expensive or simply impossible. This is where understanding the right tool for the job becomes critical. You don’t need a high-bandwidth video streaming connection to get a temperature reading. For most agricultural sensors, a low-power, long-range technology is a much better fit.
Enter LoRaWAN (Long Range Wide Area Network). This technology is a game-changer for farm connectivity. Unlike Wi-Fi, which has a range of a few hundred feet, a single LoRaWAN gateway can cover a radius of several miles. It uses very little power, meaning battery-powered sensors can last for years in the field without maintenance. The trade-off is bandwidth; LoRaWAN can only send small packets of data, like a temperature reading, a soil moisture level, or a GPS coordinate. But for 99% of farm sensor applications, that’s all you need.
Setting up a private LoRaWAN network on your farm involves a one-time cost for a gateway, which then communicates with your sensors for free. This is a stark contrast to cellular-based sensors, which often carry a monthly data fee for each device. For deploying dozens of soil moisture probes or tank level monitors, LoRaWAN is dramatically more cost-effective and practical than trying to blanket your property with Wi-Fi extenders or paying multiple cellular subscriptions.
| Technology | Range | Bandwidth | Monthly Cost | Best Use Case |
|---|---|---|---|---|
| Wi-Fi | 100-300 ft | High (video capable) | $0 (existing network) | Near buildings only |
| Cellular | Miles (with coverage) | High | $10-30 per sensor | Real-time critical data |
| LoRaWAN | 2-10 miles | Low (text only) | $0 after setup | Periodic sensor readings |
Key takeaways
- True ROI in precision ag comes from fixing specific profit leaks, not from large, untargeted technology purchases.
- Data freedom is a critical asset; prioritize equipment and software with open data formats to avoid costly vendor lock-in.
- The most effective strategy combines decision-grade data from reliable sensors with your own boots-on-the-ground experience and judgment.
How to Cut Irrigation Water Usage by 20% With Soil Moisture Sensors?
For farmers who irrigate, water is both a critical resource and a significant cost. Traditional irrigation scheduling based on a calendar or simply looking at the crop can lead to massive waste through overwatering. Soil moisture sensors provide the ground truth, telling you exactly how much water is available to the plant’s roots. By moving from a “just in case” schedule to a “just in time” strategy based on sensor data, it’s realistic to cut water usage by 20% or more without impacting yield.
The strategy involves placing sensors at multiple depths in the root zone in different management zones across your field. These sensors provide a continuous, clear picture of water availability. This data allows you to hold off on irrigating until the moisture level drops to a specific threshold, preventing waste and reducing pumping costs. It also helps you avoid waterlogged soil, which can lead to its own problems.
For example, a precision agriculture deployment on corn fields in Italy helped farmers identify zones with a biomass variation of up to 20%. This data, gathered by sensors, helped locate areas suffering from water stagnation, which increases the risk of pests and fungi. This insight allowed them to design a more efficient irrigation system that met the crop’s actual water requirements, saving water and improving overall plant health. This isn’t just about saving water; it’s about optimizing the growing environment.
Investing in a network of soil moisture sensors may seem like an upfront cost, but the return on investment is clear and relatively quick. It directly reduces expenses for water, energy, and labor. Across the board, most farmers typically achieve ROI from precision agriculture investments within two to three years. By making smarter, data-driven decisions about your single most important input, you turn a major expense into a competitive advantage.
The journey into precision agriculture doesn’t require a complete overhaul of your operation overnight. The next step is to stop trying to do everything at once. Pick one profit leak you identified in this article—be it fertilizer, data management, or water—and apply these principles to achieve your first tangible win. That success will provide the capital and confidence to tackle the next one.
Frequently Asked Questions on Precision Agriculture for Corn
What is the ‘Oracle Problem’ in agricultural blockchain?
The oracle is the physical device (sensor, weather station) that connects real-world data to the blockchain. The system’s trustworthiness depends entirely on this device’s reliability and calibration.
Can blockchain verify the accuracy of sensor data?
No, blockchain only records that specific data was entered at a specific time. It cannot verify if the sensor data itself is accurate or if the sensor is malfunctioning.
What market advantage can blockchain provide for small farms?
Even imperfect traceability records can grant access to premium markets, such as ‘Verified Low-Nitrogen Corn’ or ‘Certified Water-Efficient Corn’, turning data integrity into a marketable asset.